Kelsey Hightower on Platforms in the Agentic Era and the Launch of Massdriver v2
Watch On-Demand
cloud infrastructureobservabilitymonitoring
Observability in Kubernetes With Jaeger
Observability in K8s With Jaeger
OpenTelemetry and Kubernetes are the two most active projects at the Cloud Native Computing Foundation ( CNFC ).
This blog post aims to familiarize the reader with Jaeger , an open-source distributed tracing backend. We’ll be deploying it in a Kubernetes cluster alongside a demo application from which we will collect traces. Familiarity with basic K8s and OTel terminology is helpful but not required.
OpenTelemetry and Tracing
Most of us started “debugging” programs with log statements (printf debugging). But in a world of microservices and async concurrency, logs and metrics are insufficient tools for tracking the life cycle of a single request. Since 2019, OpenTelemetry has established itself as the standard for tracing requests through distributed systems.
Jaeger
Jaeger was developed by Uber, and after becoming open source in 2017, it was quickly incubated by the CNCF . While it lacks the feature set of some commercial tracing tools such as Honeycomb (which we use here at Massdriver), it is quick to get up and running, free, and stable.
Kubernetes
Originating at Google over 15 years ago, Kubernetes is a orchestration engine for automating the deployment and management of containers. If you’re completely new to this tool, the docs contain a number of great tutorials.
Setup
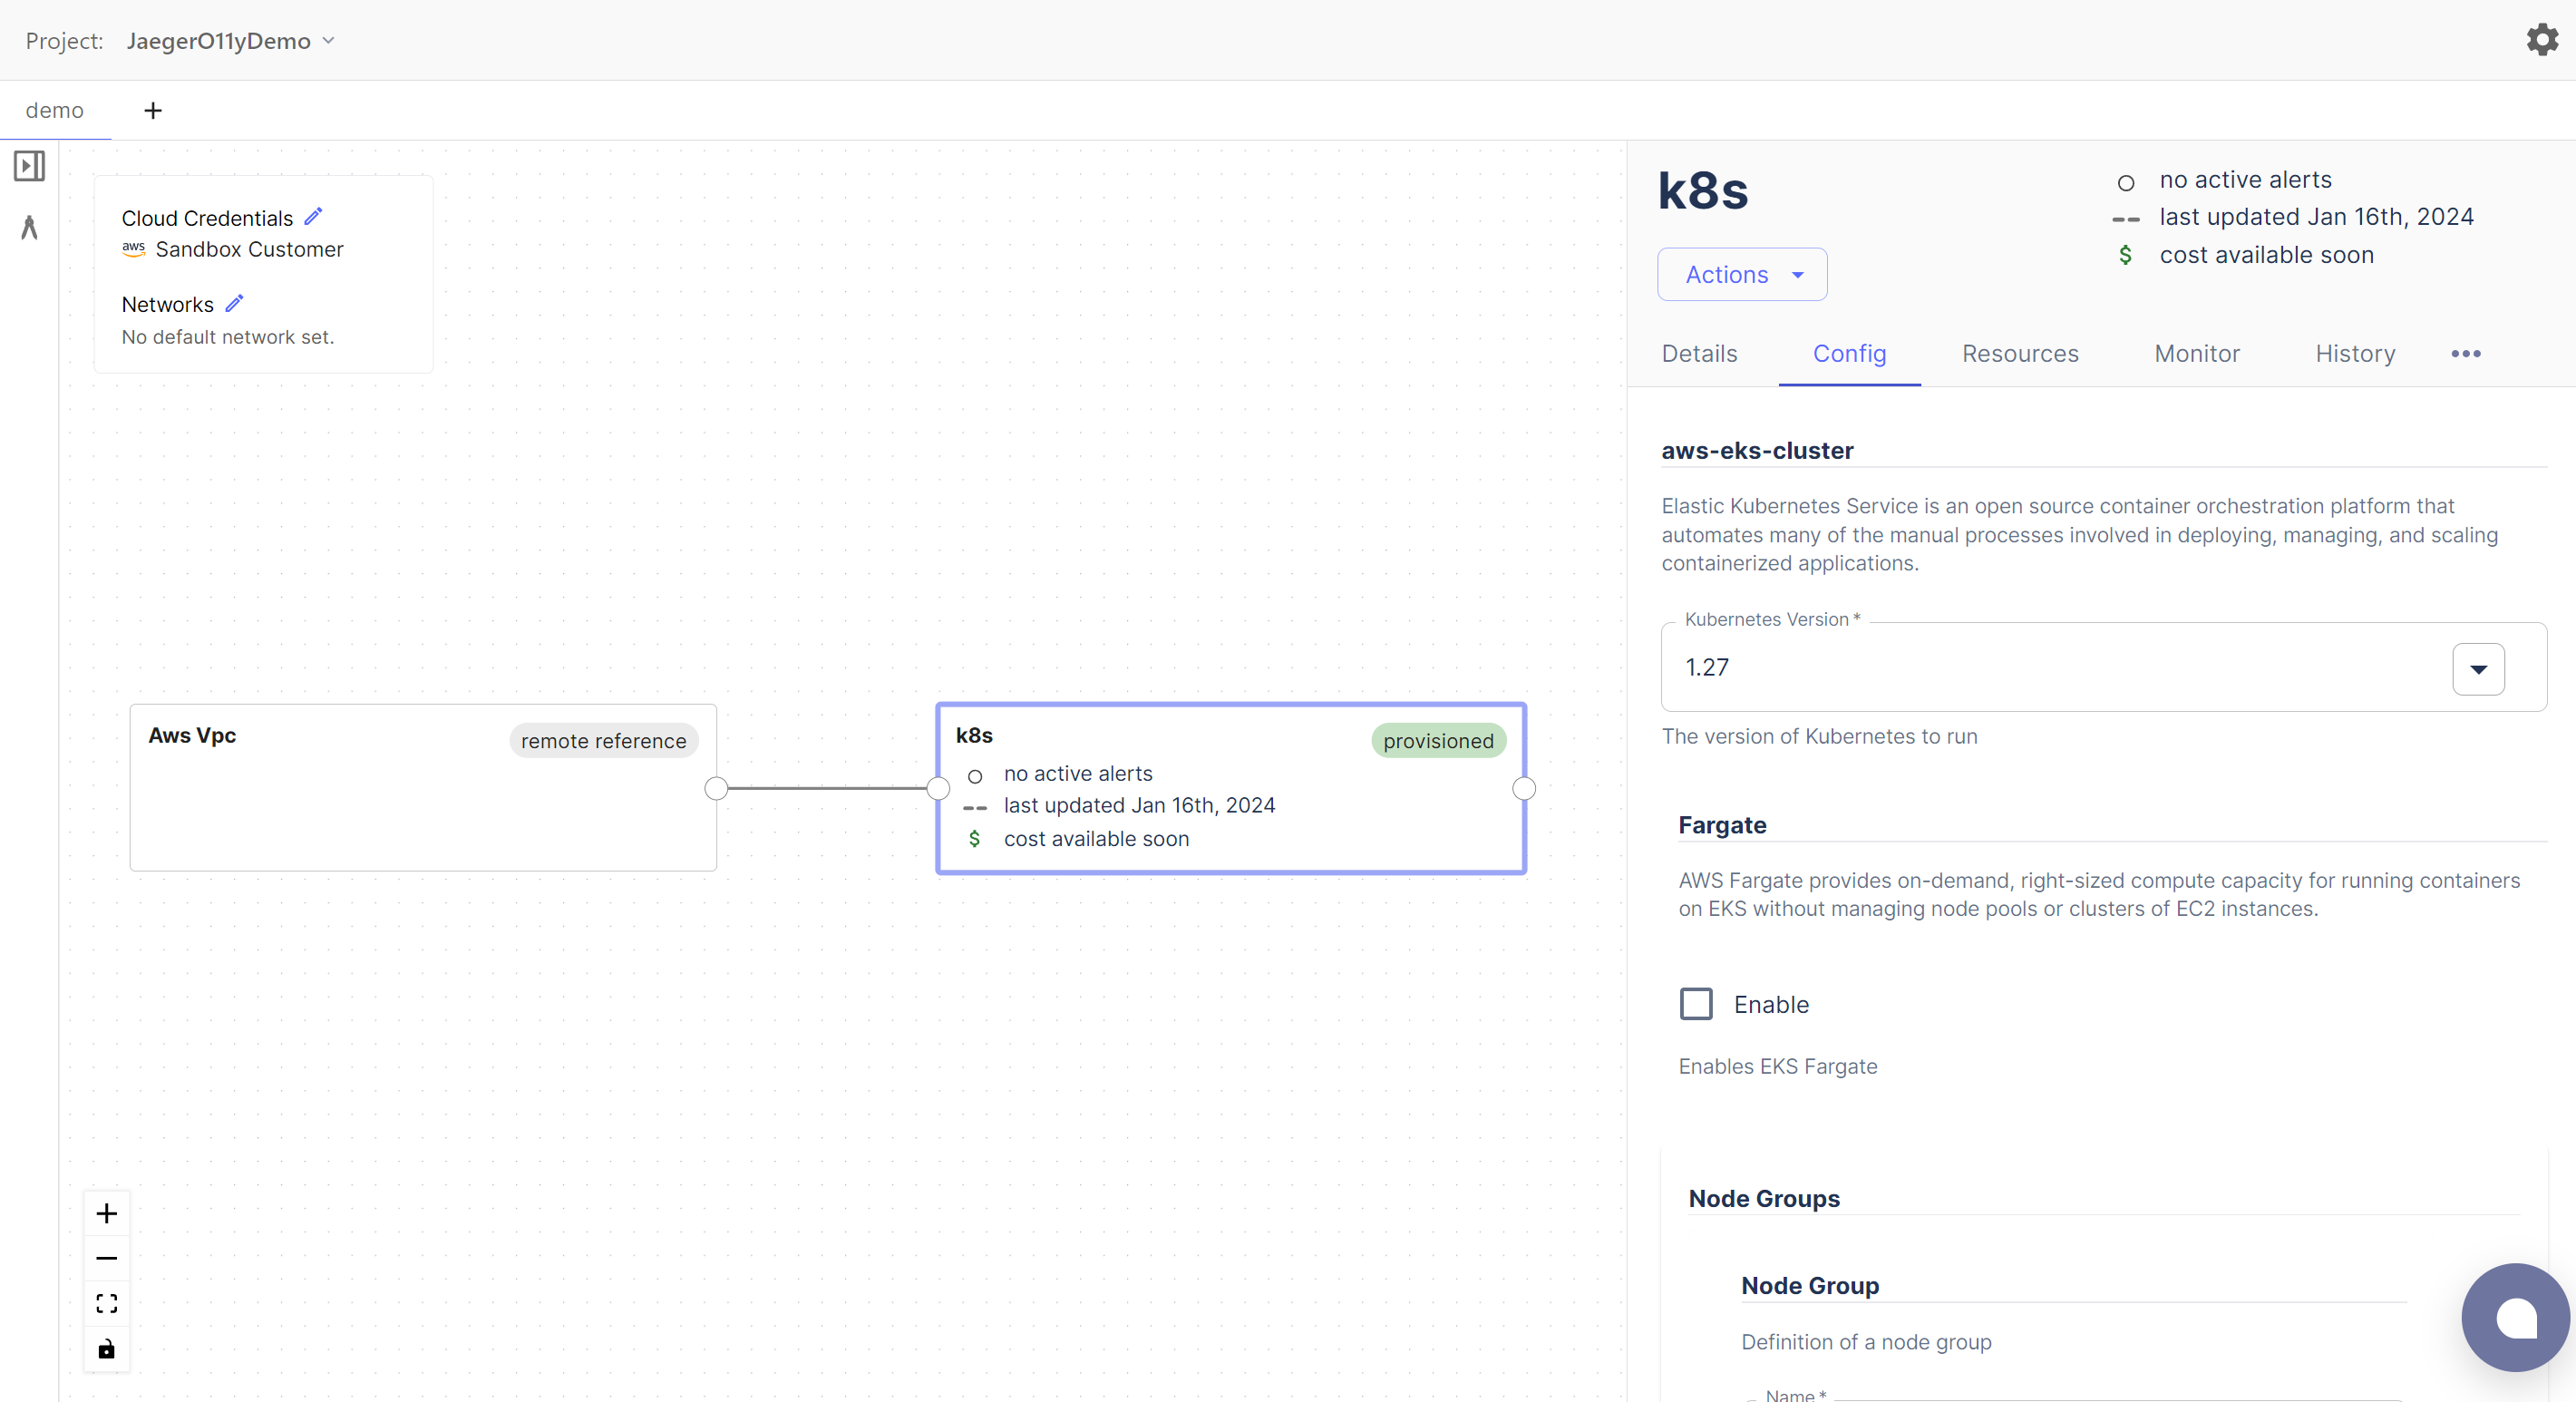
You’ll need a kubernetes cluster for this demo. For running a cluster locally on your machine, I would recomment minikube . I will be using Massdriver’s aws-eks-cluster bundle to spin up a managed cluster on AWS. The Jaeger Operator we’ll be using does require an ingress .
You will also need the Kubernetes CLI, kubectl , with access to your cluster.
Installing the Jaeger Operator
We’ll be managing Jaeger using an operator . In this case, the operator deploys and manages Jaeger for us, but operators can be used to automate all kinds of tasks. Frameworks for writing operators to extend the Kubernetes API should exist in your favorite programming language - here at Massdriver, we’re partial to bonny written in elixir .
First, we will create a namespace for all our observability-related resources:
$ kubectl create namespace observability
Then, download the Jaeger operator and install it into the newly created namespace:
$ kubectl create -f https://github.com/jaegertracing/jaeger-operator/releases/download/v1.53.0/jaeger-operator.yaml -n observability
For more information on any of the kubectl commands we’ll be using, you can use the -h flag after the command:
$ kubectl create -h
Finally, we verify that our operator is up and running:
$ kubectl get deployment jaeger-operator -n observability
NAME              READY   UP-TO-DATE   AVAILABLE   AGE
jaeger-operator   1/1     1            1           35s
Deploying Jaeger
With the operator installed, we can now apply a Jaeger custom resource to our cluster and the operator will create a Jaeger instance for us:
apiVersion: jaegertracing.io/v1
kind: Jaeger
metadata:
  name: jaeger
  namespace: observability
You can either save the above snippet in a file, say jaeger.yaml, and apply it using kubectl apply -f jaeger.yaml -n observability, or create the object directly from stdin:
$ kubectl apply -f - <<EOF
> apiVersion: jaegertracing.io/v1
> kind: Jaeger
> metadata:
>   name: jaeger
>   namespace: observability
> EOF
Now if we check our deployments in the observability namespace, we should see both the operator and the jaeger instance:
$ kubectl get deployments -n observability
NAME              READY   UP-TO-DATE   AVAILABLE   AGE
jaeger            1/1     1            1           55s
jaeger-operator   1/1     1            1           13m
We can access our Jaeger instance by port-forwarding the correct service:
$ kubectl get service -n observability
NAME                              TYPE        CLUSTER-IP       EXTERNAL-IP   PORT(S)
                       AGE
jaeger-agent                      ClusterIP   None             <none>        5775/UDP,5778/TCP,6831/UDP,6832/UDP,14271/TCP                        2m14s
jaeger-collector                  ClusterIP   172.20.216.207   <none>        9411/TCP,14250/TCP,14267/TCP,14268/TCP,14269/TCP,4317/TCP,4318/TCP   2m14s
jaeger-collector-headless         ClusterIP   None             <none>        9411/TCP,14250/TCP,14267/TCP,14268/TCP,14269/TCP,4317/TCP,4318/TCP   2m14s
jaeger-operator-metrics           ClusterIP   172.20.220.86    <none>        8443/TCP
                       15m
jaeger-operator-webhook-service   ClusterIP   172.20.66.46     <none>        443/TCP
                       15m
jaeger-query                      ClusterIP   172.20.182.145   <none>        16686/TCP,16685/TCP,16687/TCP                       2m14s
We can see two services exposed by the operator, and four exposed by Jaeger. Of those, we are currently interested in jaeger-query. 16687 is the canonical port for the Service UI.
$ kubectl port-forward svc/jaeger-query 16686 -n observability
Now you should be able to access the Jaeger UI in a web browser at localhost:16686. We don’t have any traces to search yet, so let’s leave this window open for later.
Deploying Hotrod
Hotrod is an example application by the folks at Jaeger. But instead of deploying hotrod and Jaeger together as outlined in the linked README, we’ll be writing our own deployment for the application. We will be keeping our Jaeger infrastructure in the observability namespace, and create a new namespace for hotrod:
$ kubectl create <namespace> hotrod
Following that, we need to create a Deployment , in which we declare how we would like kubernetes to run the hotrod application:
apiVersion: apps/v1
kind: Deployment
metadata:
  labels:
    app: hotrod
  name: hotrod
spec:
  replicas: 1
  selector:
    matchLabels:
      app: hotrod
  strategy: {}
  template:
    metadata:
      labels:
        app: hotrod
    spec:
      containers:
        # the image to pull
        - image: jaegertracing/example-hotrod:latest
          name: hotrod
          args: ['all']
          env:
            # the URL to which traces will be sent from the application
            - name: OTEL_EXPORTER_OTLP_ENDPOINT
              value: https://jaeger-collector.observability.svc.cluster.local:4318
          ports:
            - containerPort: 8080
              name: frontend
Save the above snippet in a file, hotrod.yaml, and deploy it via kubectl apply -f hotrod.yaml -n hotrod.
Of note here is the environment variable OTEL_EXPORTER_OTLP_ENDPOINT, which we use to specify where traces from hotrod should be sent. We know we have a jaeger-collector service, which acts similarly to the OpenTelemetry Collector , and we know it runs on port 4318. Within kubernetes, a URL to a given service can be resolved via https://<service_name>.<namespace>.svc.cluster.local:<port>, and so we can assemble the necessary URL for hotrod to send its traces to Jaeger in a different namespace.
Speaking of URLs, let us expose hotrod as a service so we don’t have to port-forward the specific pod:
$ kubectl expose deployment/hotrod -n hotrod
The hotrod namespace should now contain the hotrod deployment, replicaset, pod, and service:
$ kubectl get all
NAME                        READY   STATUS    RESTARTS   AGE
pod/hotrod-b8755f6b-cxd2b   1/1     Running   0          8m35s

NAME             TYPE        CLUSTER-IP      EXTERNAL-IP   PORT(S)    AGE
service/hotrod   ClusterIP   172.20.78.228   <none>        8080/TCP   4s

NAME                     READY   UP-TO-DATE   AVAILABLE   AGE
deployment.apps/hotrod   1/1     1            1           8m36s

NAME                              DESIRED   CURRENT   READY   AGE
replicaset.apps/hotrod-b8755f6b   1         1         1       8m35s
Now we can port-forward the hotrod service using kubectl port-forward svc/hotrod -n hotrod 8080, and visit the frontend in a browser at https://localhost:8080:
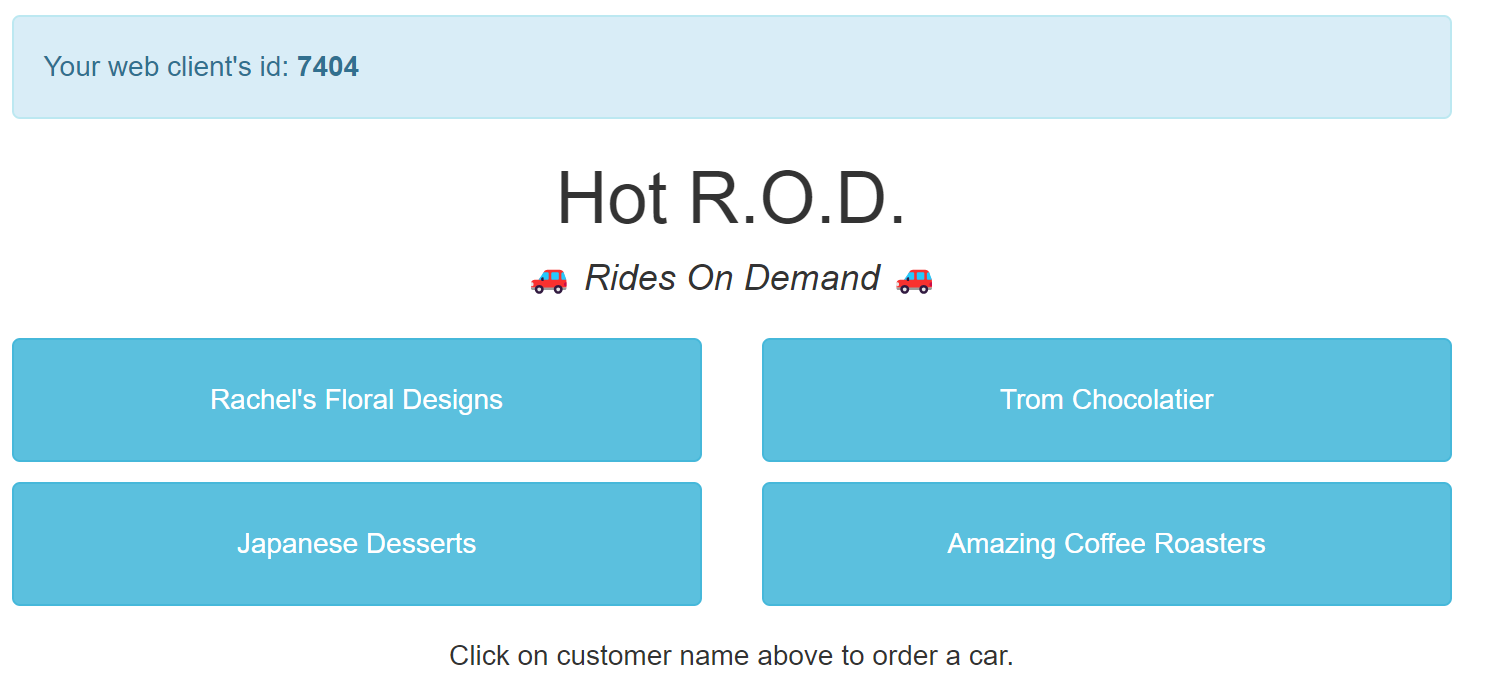
Clicking on any of the four buttons will kick off a request to the customer service to find the customer, then reach out to a mock Redis to find a driver, and finally to the route service. Given you are still port-forwarding Jaeger, you can click on open trace to view the trace in Jaeger:
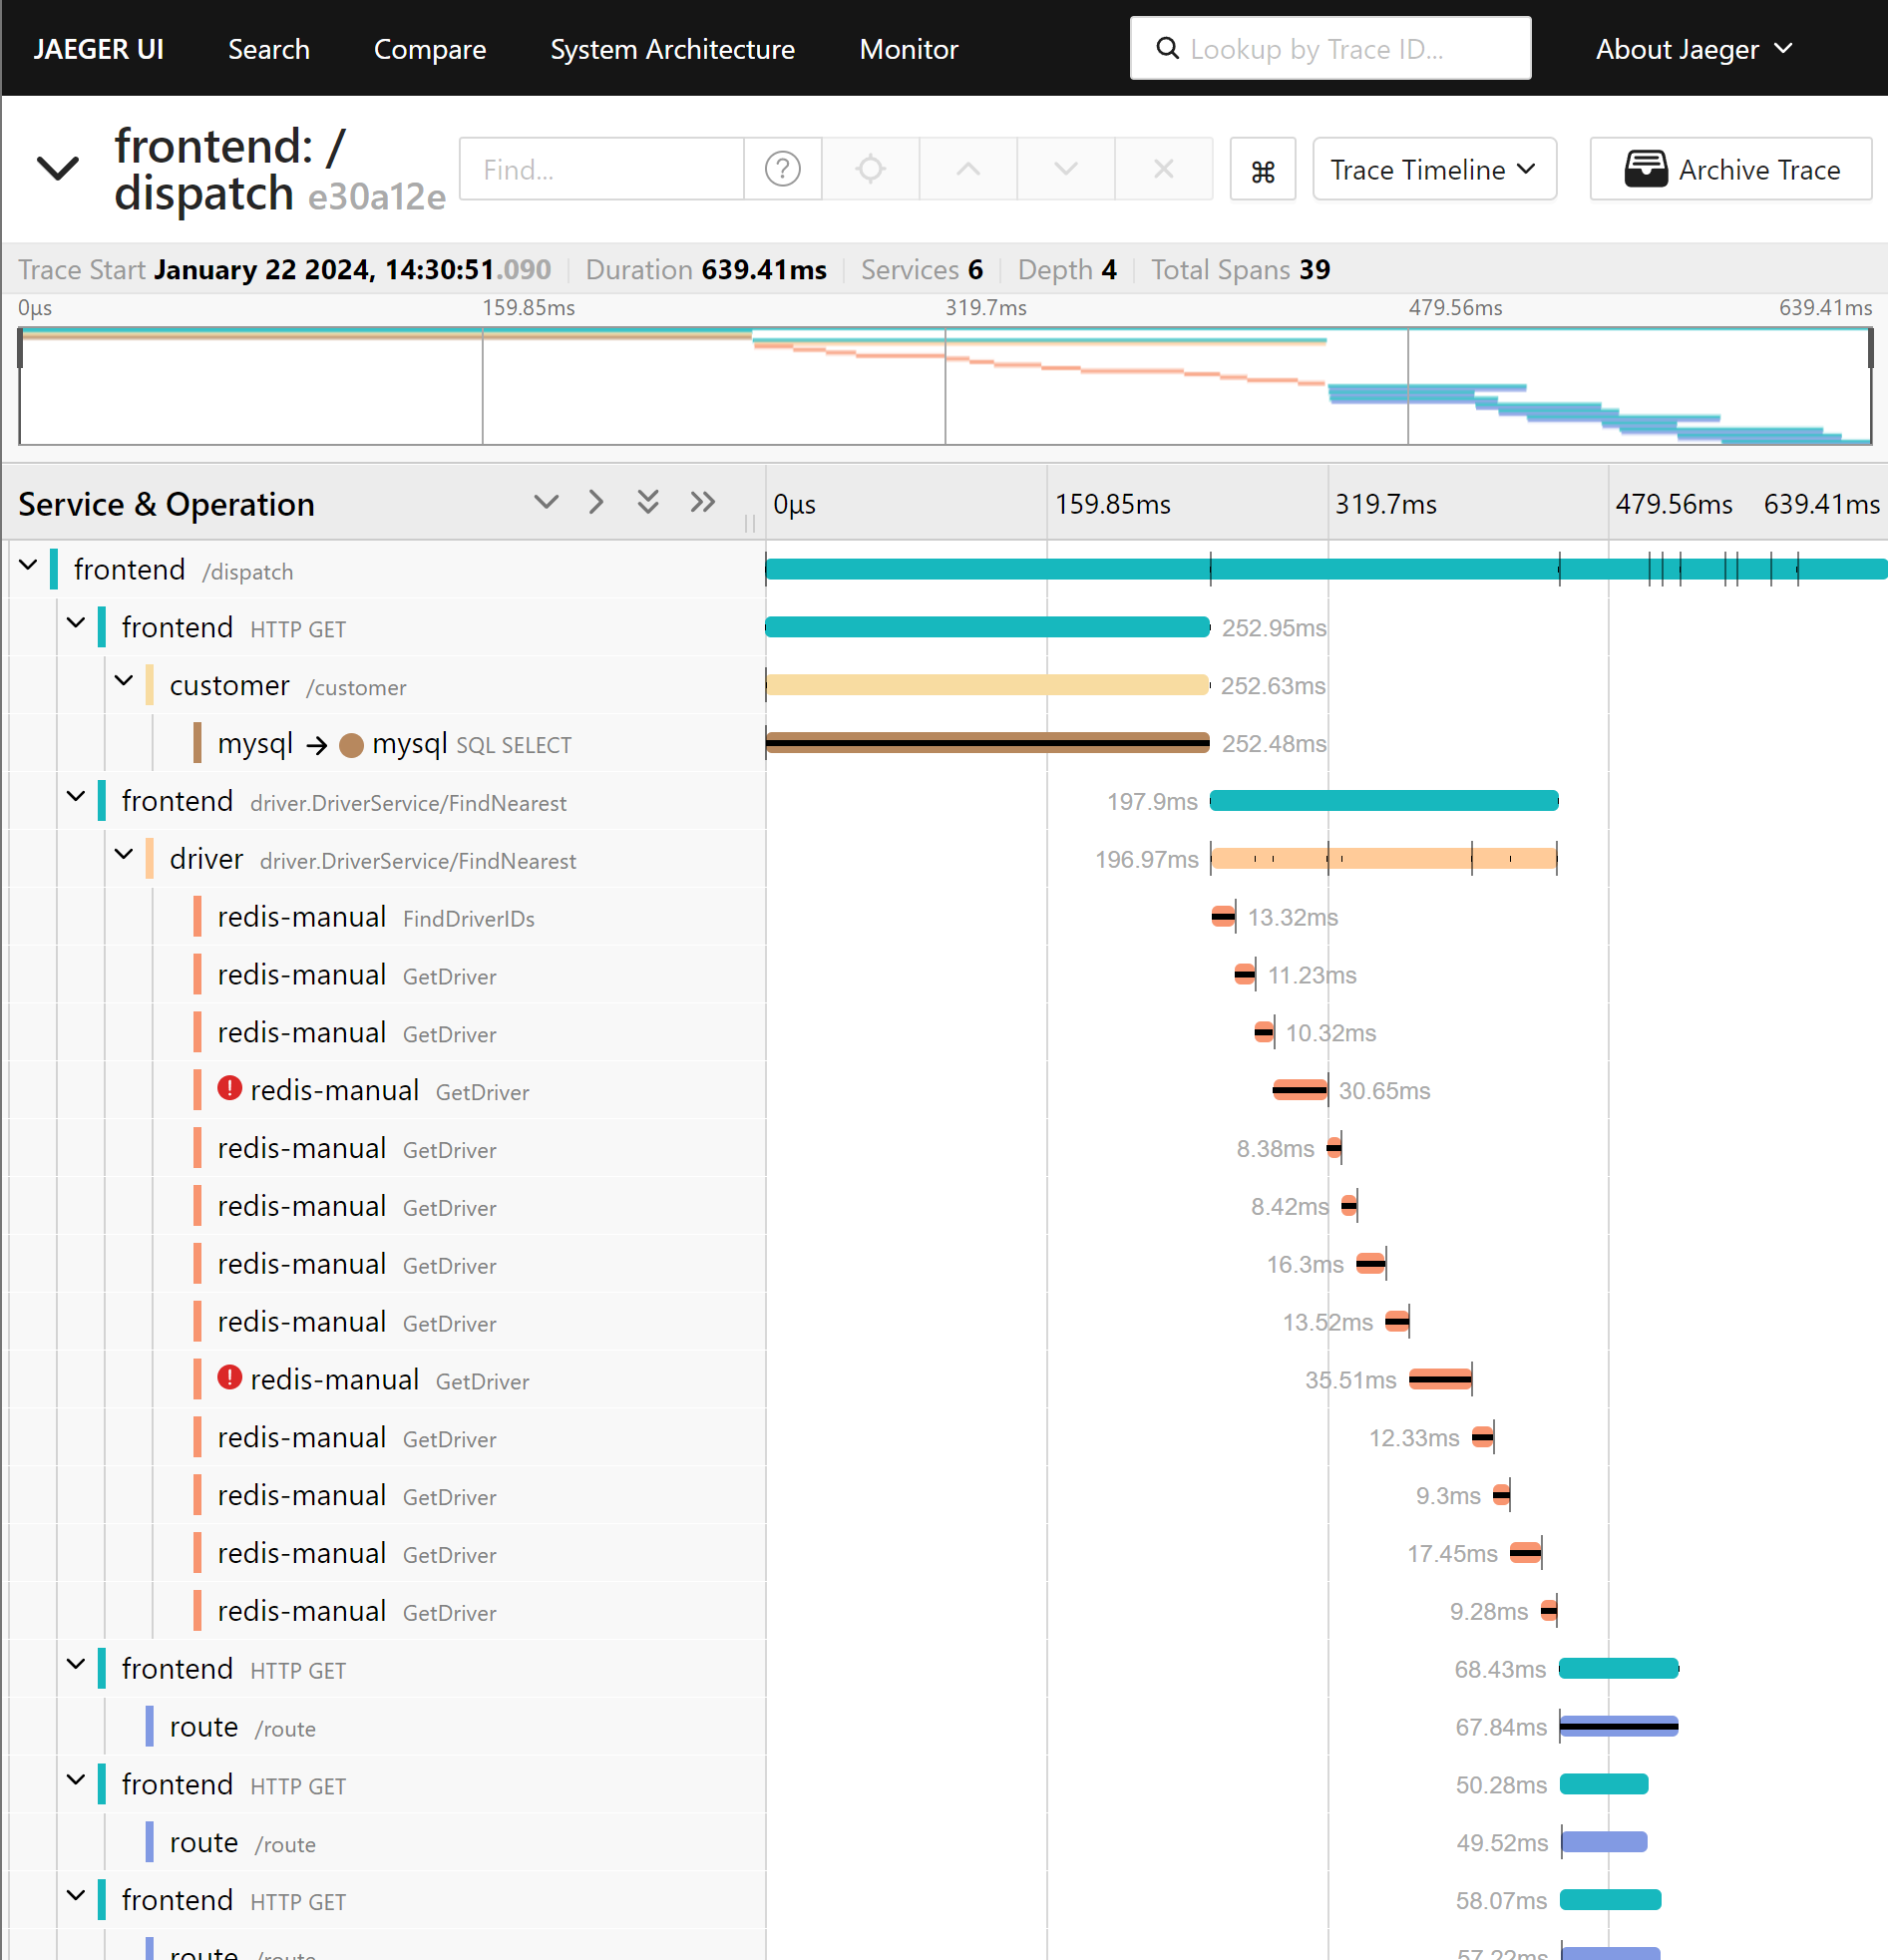
Within the trace, we can see that this single click on the hotrod web page caused a flurry of activity within a variety of microservices: the frontend first calls out to a customer service to retrieve the customer from mysql, then a driver service that makes several requests to redis to find a driver, and finally ~10 requests to a route service.
We can also see that several timeouts occurred in redis, but that the request was still able to complete successfully. We might also notice that the requests to redis to find drivers were executed in series, and could be parallelized to improve latency.
These insights would be difficult to derive from metrics and logs alone.
If we submit a high number of requests to hotrod in a small time frame, we notice that the latency of our requests increases:
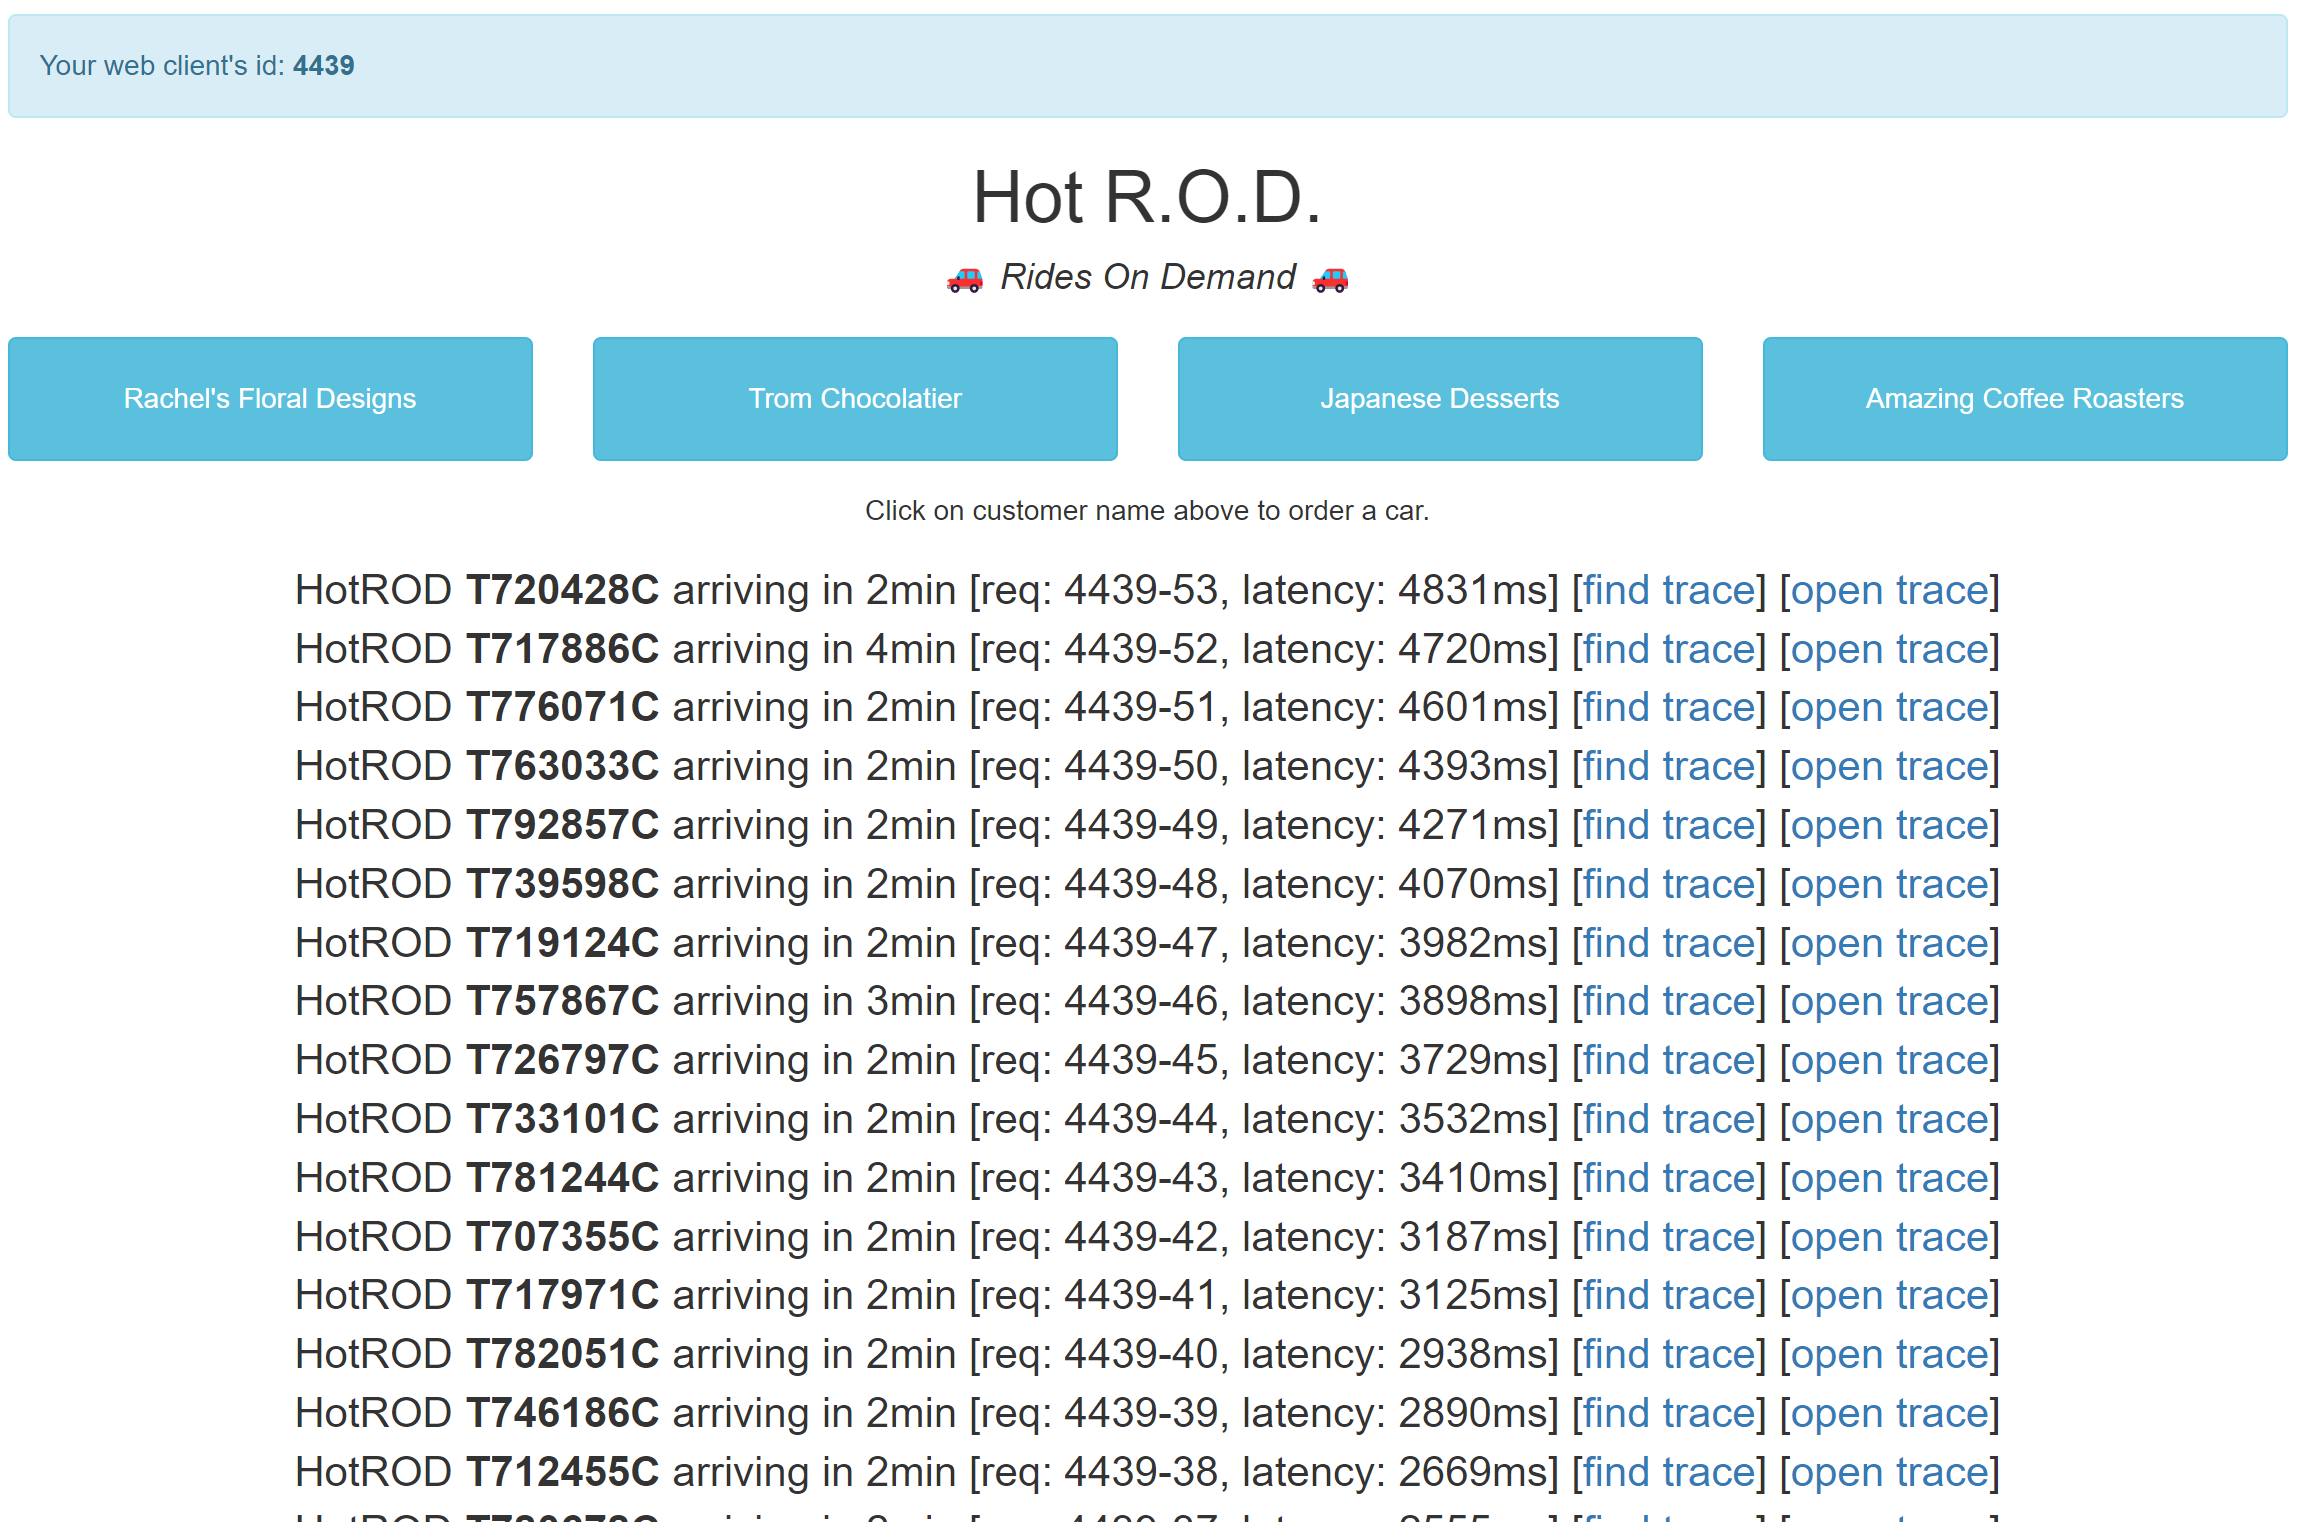
Looking at the latest trace, for driver T720428C, we find that the /customer span took about 1.4 seconds, up from the .25 seconds in the first trace we viewed. Drilling down into that span, we find the culprit in the attached logs: the request has to wait on a lock behind 4 other transactions. Another opportunity for improvement in the hotrod application. And we found all of this without needing to be familiar with hotrod’s source code.
Takeaways
Tracing, and in particular OpenTelemetry, has become a vital tool at Massdriver. We use it to profile and debug our applications, where a request can span multiple kubernetes clusters that can contain hundreds of containers. We use it to define SLOs and decide which areas of the platform we need to work on to reduce latencies and error rates. But your setup does not need to be complicated to benefit from distributed tracing - I also use it for my personal websites and projects, and with this simple setup you can as well.